SVG Visualization
The following visualizations show how you can create a visualization using custom SVG elements and d3.js.
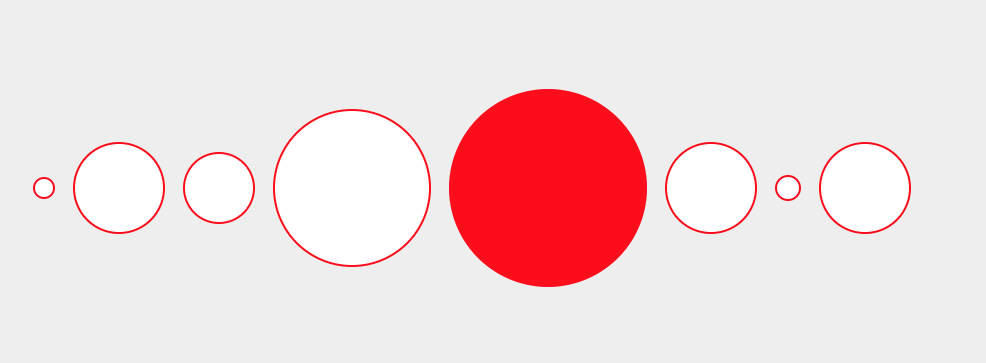
Create an index.html with the following content:
<!DOCTYPE html>
<html>
  <head>
    <meta charset="utf-8">
    <title>SVG Example</title>
    <script src="https://d3js.org/d3.v4.min.js"></script>
    <style media="screen">
      body, html {
        height: 100%;
        background: #eee;
      }
      body {
        display: flex;
        align-items: center;
        justify-content: center;
      }
      circle {
        stroke: red;
        stroke-width: 2;
        fill: white;
      }
      circle:hover {
        fill: red;
      }
    </style>
  </head>
  <body>
    <svg id="canvas">

    </svg>
    <script type="text/javascript">
      // set initial data
      var data = [
        {r: 10}, {r: 45}, {r: 35}, {r: 78},
        {r: 98}, {r: 45}, {r: 12}, {r: 45}
      ];

      // define gap size
      var gap = 20;

      // prepare svg
      var svg = d3.select('#canvas')
        .attr('width', 1500) // set absolute size!
        .attr('height', 500);

      // create a selection of circles
      svg.selectAll('circle')
        // join with data
        .data(data)
        // compute set of new rows
        .enter()
          // append a new circle element
          .append('circle')
          // define click function
          .on('click', function(d){
            // multiply value 'r' by 1.1
            d.r *= 1.1;
            // update visualization
            update();
          });

      // the function that recomputes the whole simulation
      function update() {
        var pos = 0;

        // get all circles
        svg.selectAll('circle')
          // set radius to stored 'r' value
          .attr('r', function(d){ return d.r; })
          // fix y position to 250
          .attr('cy', 250)
          // calculate x position
          .attr('cx', function(d, i){
            // set position of first circle
            if(i == 0) {
              pos = gap + d.r
              return pos;
            }
            // set position of other circles
            else {
              pos += data[i - 1].r + gap + d.r
              return pos;
            }
          });
      }

      // perform an initial update
      update();
    </script>
  </body>
</html>