Interactive Visualization
The following example shows a basic interactive visualization that reacts to the users keyboard input.
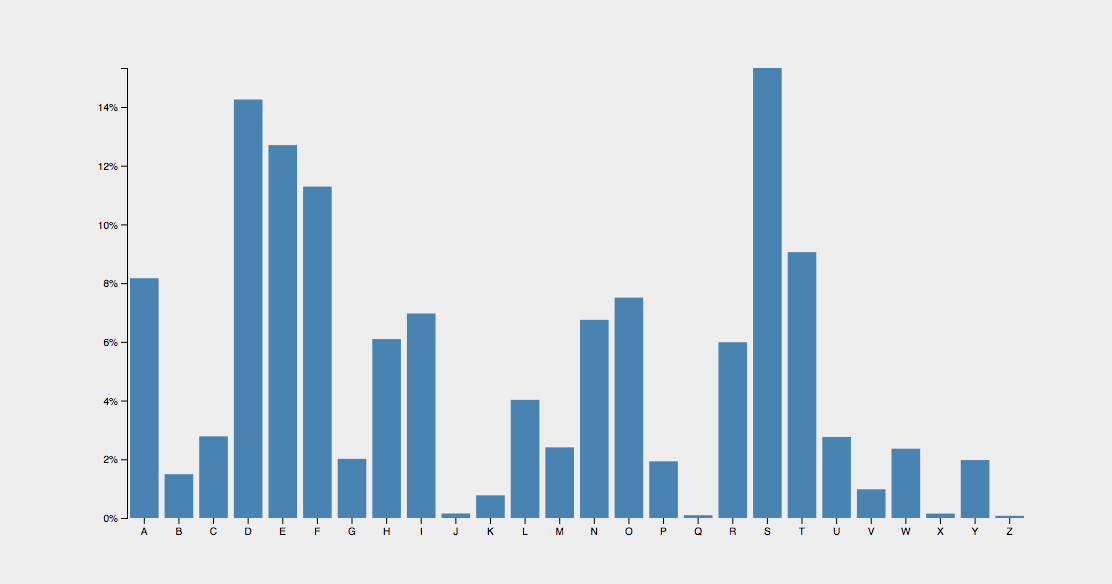
Create a data.csv file with the following content:
letter,frequency
A,.08167
B,.01492
C,.02782
D,.04253
E,.12702
F,.02288
G,.02015
H,.06094
I,.06966
J,.00153
K,.00772
L,.04025
M,.02406
N,.06749
O,.07507
P,.01929
Q,.00095
R,.05987
S,.06327
T,.09056
U,.02758
V,.00978
W,.02360
X,.00150
Y,.01974
Z,.00074
Create a index.html file with the following content:
<!DOCTYPE html>
<html>
  <head>
    <meta charset="utf-8">
    <title>Interactive Example</title>
    <script src="https://code.jquery.com/jquery-2.1.4.min.js" charset="utf-8"></script>
    <script src="https://d3js.org/d3.v4.min.js" charset="utf-8"></script>
    <style media="screen">
      body, html {
        height: 100%;
        background: #eee;
      }
      body {
        display: flex;
        align-items: center;
        justify-content: center;
      }
      .svg-chart .bar {
        fill: steelblue;
      }
      .svg-chart .bar:hover {
        fill: red;
      }
      .svg-chart .axis {
        font: 10px sans-serif;
      }
      .svg-chart .axis path, .svg-chart .axis line {
        fill: none;
        stroke: #000;
      }
      .svg-chart .x.axis path {
        display: none;
      }
    </style>
    <script type="text/javascript">
      // execute code after the page has been loaded
      $(function(){
        // we will need some margins as the coordinate space is for the bars
        // only and without the axes would be clipped from the SVG
        var margin = {
          top: 20,
          right: 20,
          bottom: 30,
          left: 40
        };

        // calculate the innter width and height of the Visualization
        var width = 960 - margin.left - margin.right;
        var height = 500 - margin.top - margin.bottom;

        // create and band scale that maps the characters to positions on
        // the band which is our entire width of the visualization
        var xScale = d3.scaleBand()
          .range([0, width], .1);

        // create a linear scale that maps the frequency to our height
        var yScale = d3.scaleLinear()
          .range([height, 0]);

        // create an SVG axis which will render the axis later for us
        var xAxis = d3.axisBottom()
          .scale(xScale);

        // the same for the x axis
        var yAxis = d3.axisLeft()
          .scale(yScale)
          .ticks(10, '%');

        // this is the basic configuration of our SVG element
        var svg = d3.select('.svg-chart')
          .attr('width', width + margin.left + margin.right)
          .attr('height', height + margin.top + margin.bottom)
          .append('g')
            .attr('transform', 'translate(' + margin.left + ',' + margin.top + ')');

        // we will create a container for the x axis
        var xAxisG = svg.append('g')
          .attr('class', 'x axis')
          .attr('transform', 'translate(0,' + height + ')');

        // same goes for the y axis
        var yAxisG = svg.append('g')
          .attr('class', 'y axis');

        // a function to convert the incoming CSV
        function convert(d) {
          d.frequency = parseFloat(d.frequency);
          return d;
        }

        // load the CSV file and convert the data
        d3.csv('data.csv', convert, function(data) {
          // we select all our .bar elements
          svg.selectAll('.bar')
            // bind it to our incoming data
            .data(data)
            // calculate the entry set
            .enter()
              // append a new rect element for each new entry
              .append('rect')
                .attr('class', 'bar');

          // this function will recalculate our visualization
          function update() {
            // we reserve a spot for each letter on the band
            xScale.domain(data.map(function(d) {
              return d.letter;
            }));

            // we look for the highest value
            yScale.domain([0, d3.max(data, function(d) {
              return d.frequency;
            })]);

            // create/update the SVG elements representing the axes
            xAxisG.call(xAxis);
            yAxisG.call(yAxis);

            // select all the bars
            svg.selectAll('.bar')
              // set the position and size using the scales
              .attr('x', function(d) {
                return xScale(d.letter)+3;
              })
              .attr('width', xScale.bandwidth()-6)
              .attr('y', function(d) {
                return yScale(d.frequency);
              })
              .attr('height', function(d) {
                return height - yScale(d.frequency);
              });
          }

          // register a listener for the key press event
          $(document).keypress(function(e){
            // get the resulting letter
            var letter = String.fromCharCode(e.keyCode).toUpperCase();

            // look through the data
            data.forEach(function(d){
              // when found increment frequency
              if(d.letter == letter) {
                d.frequency += 0.01;
              }
            });

            // recalculate the visualization
            update();
          });

          // initially render the visualization
          update();
        });
      });
    </script>
  </head>
  <body>
    <svg class="svg-chart"></svg>
  </body>
</html>