A basic Barchart
The following example shows a basic usage of d3.js to render a bargraph of country's population.
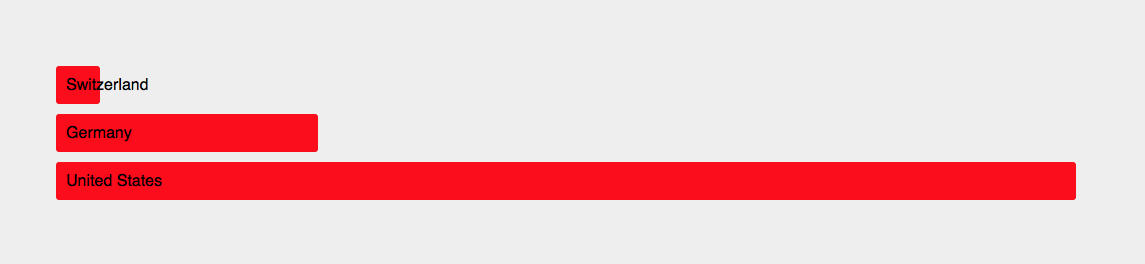
Create a data.csv file with the following content:
Country,Population
Switzerland,8000000
Germany,80000000
United States,330000000
Then, create an index.html file with the following content:
<!DOCTYPE html>
<html>
  <head>
    <meta charset="utf-8">
    <title>D3 Barchart</title>
    <script src="https://d3js.org/d3.v4.min.js"></script>
    <style media="screen">
      body, html {
        height: 100%;
        background: #eee;
      }
      body {
        display: flex;
        align-items: center;
        justify-content: center;
      }
      .list .country {
        background-color: red;
        padding: 10px 10px;
        border-radius: 3px;
        margin: 10px 0;
        color: black;
        font-family: sans-serif;
      }
    </style>
  </head>
  <body>
    <div class="list">
    </div>

    <script type="text/javascript">
      // convert is called with every row in the csv file
      function convert(d) {
        d.Population = parseInt(d.Population);
        return d;
      }

      // load csv and invoke callback with the loaded data
      d3.csv('data.csv', convert, function(data){
        // prepare a scale for the population domain
        var scale = d3.scaleLinear()
          .domain([0, d3.max(data, function(d){
            return d.Population;
          })])
          .range([0, 1000]);

        // create a selection of divs with the class country
        // in the div with the class list
        d3.select('.list').selectAll('.country')
          // join with the loaded data
          .data(data)
          // compute set of added rows
          .enter()
            // append a new div to the selection
            .append('div')
              // set class
              .attr('class', 'country')
              // map width of element to population
              .style('width', function(d){
                return scale(d.Population) + 'px';
              })
              // set content to the country's name
              .text(function(d){
                return d.Country;
              });
      });
    </script>
  </body>
</html>
Adjust the example to your needs.