p5.js Introduction
What's p5.js?
p5.js is JavaScript (JS) library, which is used for creating graphic and interactive experiences for artists and designers. The code is written directly in JS, and it gets executed like any other JS file that is included on a website. It requires an empty HTML file that links to the p5.js library and your sketch file in the header.
p5.js based on the core principles of Processing, which enables code to take the form of quick “sketches” rather than complex applications. There are some differences in the language syntax in Processing, because it’s based on Java, but it’s otherwise very similar.
Using p5.js
The easiest way to get started is with Openprocessing.org. It's an online platform, where anyone can create and share visual-based, open-source projects. The big advantage of open processing is that the users can like and comment on other sketches, follow other users and create themed collections.
Alternative Editors
p5.js has its own web-based editor which compiles the code on the go and displays it directly in the browser.
The Processing IDE can be used for p5.js when put in Javascript mode.
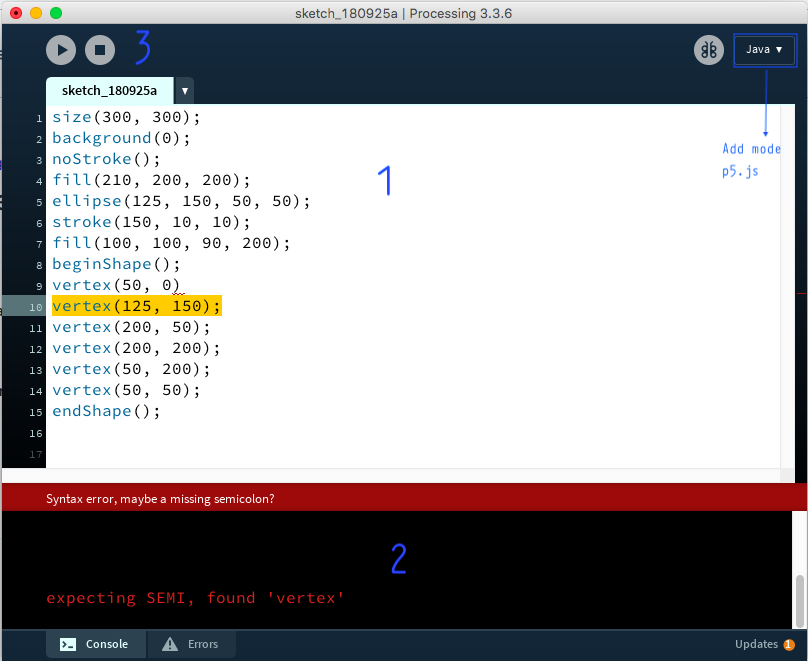
The IDE consists of three main parts.
The text editor, where you can write (or paste in) the code.
Message area and Console/Errors window. The Message area which displays the errors and is useful to see if you e.g., miss a semicolon. The Console/Errors window displays warnings, but can be also used to output text for debugging.
The final part is the Display window. This is where you can see the results of our code after it is compiled, by pressing the Run button in the upper left corner.
The third option is to use one of the text editors e.g. Sublime, Atom, Visual Studio Code and run p5.js directly on your computer. For that, you would need to download the p5.js library and run the code on a local server. For more experienced developers, p5.js can also be used in any web application using npm and the "instance mode" of p5.js
References:
In order to understand the examples and to write your own programs, you will be using the p5.js reference page. Reference pages are essential for understanding how programming languages and frameworks like p5.js can be used.
Basic Sketch Structure
Every p5.js program consists of setup() and draw() function. Setup() runs when the program starts, and it's used to set the initial environment properties, such as the size of the canvas in the browser window. Draw() executes the code inside the block until the program is stopped or noLoop() is called. We will learn more about how functions work in the p5.js Events and Functions.
function setup() {
  createCanvas(300,300);
  // setup stuff
}

function draw() {
  // draw stuff
}
You will notice there are some special symbols used here, and everything is organised in a specific structure. The syntax of a programming language defines how all these things should be used. We will get to know what all these symbols do in the following examples.
Example 1 : Graphic output
This example shows how to draw graphics directly to an output window.
function setup(){
	createCanvas(300,300); // define canvas size
	stroke(255,255,255); // define line colour
}

function draw() {
	background(0); // define background colour
	strokeWeight(1); // line thickness
	line(100,10,100,150); // draw a line
	line(150,10,150,200);
	line(200,10,200,250);
	fill(0,0,0); // define fill colour
	strokeWeight(5); // line thickness
	ellipse(100,150,50,50); // draw an ellipse
	ellipse(150,200,50,50); // draw an  ellipse
	noFill(); // turn of fill
	ellipse(200,250,50,50); // draw an  ellipse
}
Example 2 : Complex Forms
This example shows you how to change line attributes and how to draw more complex shapes using the beginShape() and endShape() functions.
function setup() {
	createCanvas(300,300); // define canvas size
	stroke(255); // define line colour
	strokeWeight(8); // line thickness
	strokeJoin(MITER); // this is the default
 	//strokeJoin(BEVEL);
 	//strokeJoin(ROUND);
	noFill();
}

function draw() {
	background(0); // define background colour
	beginShape();
 	vertex(50,50);
 	vertex(200,50);
 	vertex(200,200);
 	vertex(50,200);
 	vertex(50,100);
 	vertex(150,100);
 	vertex(150,150);
	endShape();
}
Example 3: Colors and Transparency
Colours are defined with 3 values, the so-called RGB values. The colour consists of three components (red + green + blue) and is determined by additive colour mixing. The value of each colour can range from 0-255.
This range of numbers results from the fact that each colour value represents an 8-bit value. Therefore, true colour can be represented with 24-bit (3 * 8-bit = RGB).
Forms can also be transparent, using the alpha channel. The colour is simply extended by a 4th parameter (RGBA). Smaller alpha values are more transparent than greater ones.
function setup() {
	createCanvas(300,300);
	noStroke();
}

function draw() {
	background(0);
	fill(210,200,200);
	ellipse(125,150,50,50);
	stroke(150,10,10);
	fill(100,100,90,200);
	beginShape();
 	vertex(50,50);
 	vertex(125,150);
 	vertex(200,50);
 	vertex(200,200);
 	vertex(50,200);
 	vertex(50,50);
	endShape();
}
Exercise 1:
Experiment with the examples by adding or combining new drawing commands (Arc, Point, Triangle, etc.). Look through the references page to find more.