p5.js Tiling and Repetition
Creating grids
Arrays in JavaScript have quirks of their own that you may not be expecting if you come from other languages. Two important ones for your use case are:
You cannot directly declare multidimensional arrays in JavaScript.
There's little efficiency benefit (and no added safety) when you set the size of the array at creation.
In order to create and initialize a multidimensional array, you first need to go through all elements of the one-dimensional array and add a second (third, fourth, etc.) dimension to it.
var x_length = 100
var y_length = 100
var map = []

for (var x = 0; x < x_length; x++) {
  map[x] = []
  for (var y = 0; y < y_length; y++) {
    map[x][y] = new Element();
  }
}
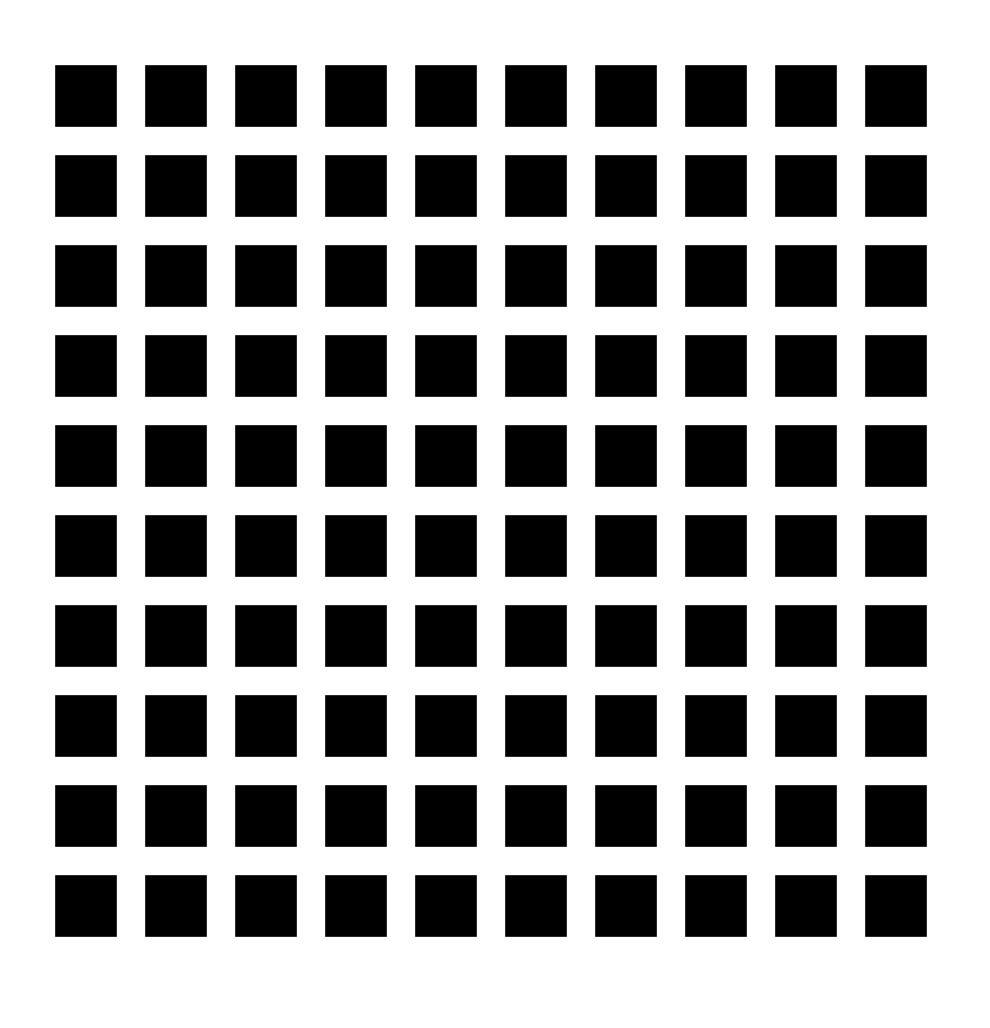
let gridW = 10; //amount of shapes in the width
let gridH = 10; //amount of shapes in the height
let stepX = 60; // horizontal distance between shapes
let stepY = 60; // vertical distance between shapes
let shapeWidth = 40;
let shapeHeight = 40;
var GraphicArray = [];


function setup()
{
  createCanvas(800, 800);
  noStroke();
  fill(0);
  background(255);

  translate((width-(stepX*gridW))/2, (height-(stepY*gridH))/2);  // translate graphic to the center of the screen

  for (var i=0; i < gridW; i++)
  {
    GraphicArray[i] = []; //add a second dimension to the array
    for (var j = 0; j < gridH; j++)
    {

      GraphicArray[i][j] = new Graphic(i * stepX, j * stepY, shapeWidth, shapeHeight);
      GraphicArray[i][j].draw();
    }
  }
}


class Graphic
{

  constructor(x,y, shapeW, shapeH)
  {
    this._pos = createVector(x, y);
    this._shapeWidth = shapeW;
    this._shapeHeight = shapeH;
  }

  draw()
  {
    push();
    stroke(0);
    fill(0);
    rect(this._pos.x, this._pos.y, this._shapeWidth, this._shapeHeight);
    pop();
  }
}
Example: Modifying distribution along width and height
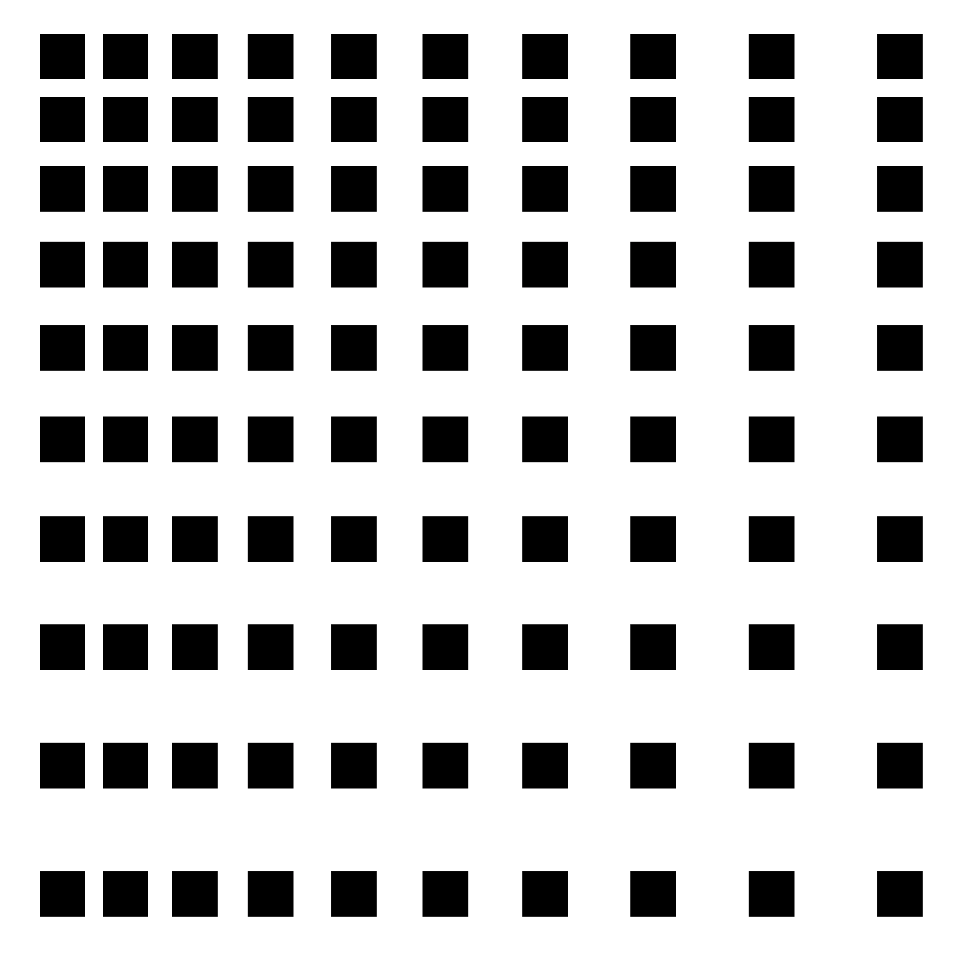
let gridW = 10;
let gridH = 10;
let border = 100;
let stepX = 40;
let stepY = 40;
let distModifier = 1.05;
let graphicSize = 30;

function setup()
{
  createCanvas(800,800);
  background(255);
  noStroke();
  fill(0);

  let distX = stepX;
  let distY = stepY;
  translate(border,border);

  for(var i=0;i < gridH;i++){
    for(var  j= 0;j < gridW;j++) {
      rect(j * distX, i * distY, graphicSize, graphicSize);
      distX *= distModifier;
      }
  distX = stepX;
  distY *= distModifier;
  }
}
Example: Modifying distribution with scale
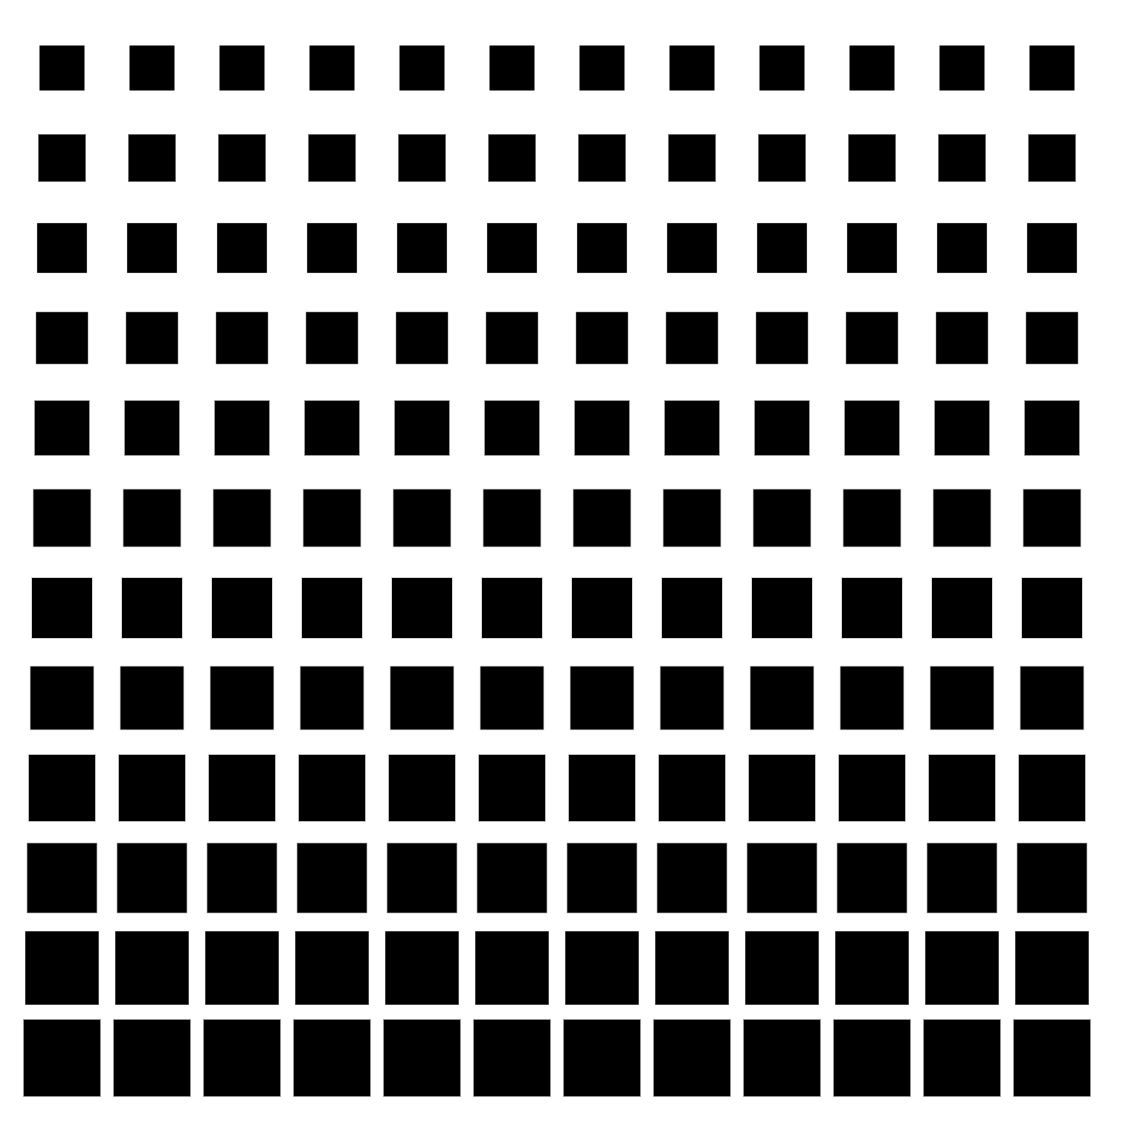
let gridW = 12;
let gridH = 12;
let border = 60;
let stepX = 60;
let stepY = 60;
let sizeModifier = 1.05;
let graphicSize = 30;


function setup()
{
  createCanvas(800, 800);
  noStroke();
  fill(0);
  background(255);
  rectMode(CENTER);
  let graphicSizeScaled = graphicSize;
  translate(border, border);
  for (var i=0; i < gridH; i++)
  {
    for (var j = 0; j < gridW; j++)
    {
      rect(j * stepX, i * stepY, graphicSizeScaled, graphicSizeScaled);
    }
    graphicSizeScaled *= sizeModifier;
  }
}
Example: Modifying distribution by rotation
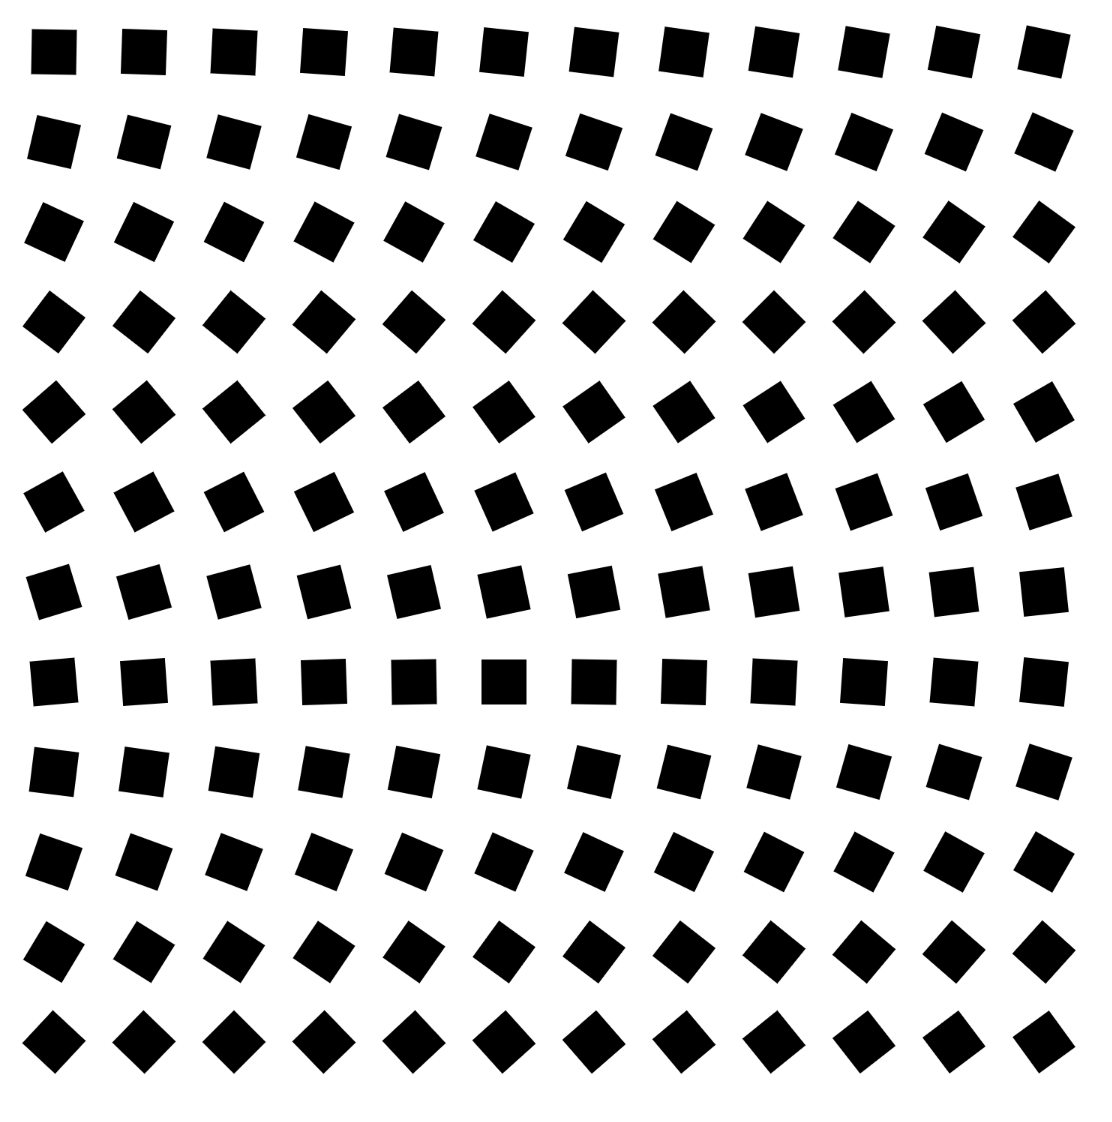
let gridW = 12;
let gridH = 12;
let border = 60;
let stepX = 60;
let stepY = 60;
let sizeModifier = 1.05;
let graphicSize = 30;


function setup()
{
  createCanvas(800, 800);
  noStroke();
  fill(0);
  background(255);
  rectMode(CENTER);

  var rotation = 0;
  translate(border, border);

  for (var i=0; i < gridH; i++)
  {
    for (var j = 0; j < gridW; j++)
    {
      rotation++;
      push();
      translate(j * stepX, i * stepY);
      rotate(radians(rotation));
      rect(0, 0, graphicSize, graphicSize);
      pop();
    }
  }
}